


According to the Centers for Disease Control and Prevention, burns are one of the leading causes of nonfatal injury in the United States, across all age ranges [1]. Thermal injuries account for approximately 10% of combat casualties in the modern era [2], and these injuries are increasingly incurred in tandem with blast or explosion wounds [3]. For instance, burns comprised 5% of all casualties evacuated from Operation Iraqi Freedom and Operation Enduring Freedom between April 2003 and April 2005 [3]. Due to improved combat burn care and shorter response times, burn injury survival rates have risen since the Vietnam era, but thermal injuries from explosions are likely to pose a continued threat to U.S. forces.
In a battlefield setting, wounded warfighters must be triaged in order to identify the priority of medical treatment and evacuation. Early and close assessment of burn degree (i.e., severity level) informs sound decisions on the type of treatment to be given. However, such burn analysis can be highly subjective, and the unstable nature of burn wounds can further complicate the decision-making process. Research has long shown that early treatment decisions regarding burn injuries result in shorter hospital stays and lower rates of infection [4, 5]—underlining the importance of rapid assessment.
To date, Department of Defense (DoD) entities, such as U.S. Army Medical Research and Materiel Command and the Military Medical Photonics Program, have sponsored research and development in non-invasive techniques like terahertz imaging, infrared spectroscopy,
laser Doppler imaging, and reflectance mode confocal microscopy [6]. However, current methods for burn triage are mostly visual and checklist-based [7].
To counter these challenges, we present a novel and portable battlefield point-of-care diagnostic system that combines two complementary optical technologies, Optical Coherence Tomography (OCT) and Raman Spectroscopy (RS), with a clinical decision support system. This system can (a) promptly and accurately classify burn severity, and (b) recommend a course of action for urgent treatment. Applying point-of-care diagnostics to burn injuries will provide medics or the first line of field caregivers an essential tool for providing optimal treatment to injured warfighters [8].
Limitations of Existing Diagnostic Techniques
An accurate assessment of burn severity (i.e., superficial, superficial-partial, deep-partial, or full thickness) is crucial in determining the type of intervention required to treat a burn victim. A conventional method of identifying burn severity is through visual perception, which is mainly based on the total body surface area (TBSA). Although superficial and full-thickness types of burns are visually discernable, it can be difficult even for experienced surgeons to accurately distinguish superficial-partial and deep-partial thickness burns [9, 10]. Currently, laser Doppler imaging (LDI) is often used as a non-invasive diagnostic tool for estimating burn degree [11]. LDI assesses burn depth by measuring the perfusion index (PI), defined as the measure of microcirculatory changes in skin obtained through Doppler shift of reflected laser light.
Observational studies have reported a good correlation between LDI’s PI and burn depth. However, due to the influence of reactive vasoconstriction, LDI’s diagnostic accuracy is highest when used more than 24 hours after the onset of injury [12]. Furthermore, changes in PI are susceptible to conditions such as anemia or infection, leading to obscure perfusion maps. Physical barriers, such as the curvature of tissue surface, scanning distance, and thickness of topical dressings, also influence LDI’s outcomes [13, 14]. A survey study of burn centers in the United States reported in 2014 that surgeons depended mostly on clinical examination (60%), LDI (6%), and biopsy (4%) to estimate burn depth [12]. The study also highlighted cost (72%), restricted availability of access (63%), and the absence of up-to-date evidence (35%) as the three main barriers to incorporating new technologies [15].
Assessing Burn Severity with a Complementary “Bimodal” System
Definitive treatment and monitoring of a typical burn wound requires assessment of changes in skin thickness (i.e., the amount of skin tissue damaged and extent of layers involved) along with functional aspects of the underlying skin components. Capturing structural morphology and the chemical nature of skin tissue is of great significance in order to effectively analyze burn wounds. We propose a diagnostic system that can precisely identify burn severity based on features combined from two complementary optical techniques: OCT and RS.
OCT is an imaging technique which uses the principle of low-coherence interferometry to capture cross-sectional images of biological tissues with micro resolution. This allows for the visualization of structures up to 1–2 mm under the surface of highly irregular, light-scattering tissues such as skin. OCT produces a 2D image known as a B-scan, which is composed of a series of lateral A-scans. Several B-scans acquired over an area enable 3D reconstruction of the target region. Because intensity-varied pixels in an OCT image represent the amount of light scattered
from target tissue, changes in the optical properties of a target area of tissue are reflected in the image. Birefringence is known to degrade due to the loss of collagen caused by a burn injury, thereby restricting the penetration of light. Consequently, a converse relation between the
cross-sectional depth estimate (derived from the OCT image) and the severity of the burn can be evaluated [16]. Furthermore, analyzing intensity-based textural measures may help differentiate burn characteristics.
OCT has been effectively employed to study different skin conditions in terms of anatomy and physiology [17], where specific characteristic features, such as the thickening of the epidermis, signal attenuation in the dermis, and homogenous signal distribution from OCT scans, helped recognize skin tumors and inflammation [18, 19]. Other variants of OCT, namely polarization-sensitive OCT and OCT angiography, have also proved useful in studies for evaluating different skin abnormalities and burns [20–22].
RS relies on the shift in wavelength of the inelastically scattered light (Raman shift). This takes place when electromagnetic waves interact with molecules of a given target, revealing their chemical structures. The chemical sensitivity of biomolecules (e.g., proteins, lipids, nucleic acids) can be used to analyze their corresponding spectral changes. Since it is known that constituent proteins in skin are denatured as a result of a burn, the respective spectra may be correlated with burn severity [23].
The utility of RS in diagnosing skin conditions has been demonstrated in multiple studies, where researchers have shown associated changes in lipid molecules of the corneum stratum layer with Raman spectra [24], distinguished malignant from benign skin lesions with high sensitivity [25], and used confocal RS to provide differential diagnoses of melanoma, basal cell carcinoma, and other non-melanoma skin cancers [26, 27]. The ability of RS to extract hydration-relevant details from skin and heterotopic ossification due to burns highlights the significance of employing RS to assess burn wounds [27, 28 ].
An amalgamation of these two techniques can produce a system that leverages the complementary capabilities of each. As such, microstructural details from OCT wide-field images, along with spectral features corresponding to biochemical specificity of underlying skin molecules, can together accurately and reliably diagnose the severity of burns. Experiments utilizing this RS-OCT system have already successfully recognized cancer skin lesions and tissues of liver, kidney, and small intestine [29, 30].
RS-OCT-based Identification of Burn Severity
Experimental Setup
UtopiaCompression Corporation (UC) collaborated with Vanderbilt University (VU) in Nashville, Tennessee, to develop a reliable burn classification system by combining RS and OCT optical techniques. Ex vivo experiments on porcine skin to collect data on burn wounds were conducted at VU, whereas UC carried out the data processing, analysis, and development of classification models.
As part of the study, burn wounds were inflicted on cadaver porcine skin samples by following a protocol set by Ponticorvo et al. [31], wherein a soldering rod heated to 140 degrees Celsius was used to create burn wounds for contact durations of 5, 10, and 15 seconds. Considering the sample size criterion required for valid statistical analysis and inference, 26 wounds for each contact time were generated (5s: N=26, 10s: N=26, 15s: N=26) (see Figure 1a), and a histological test using trichrome staining was performed to confirm burn severity.
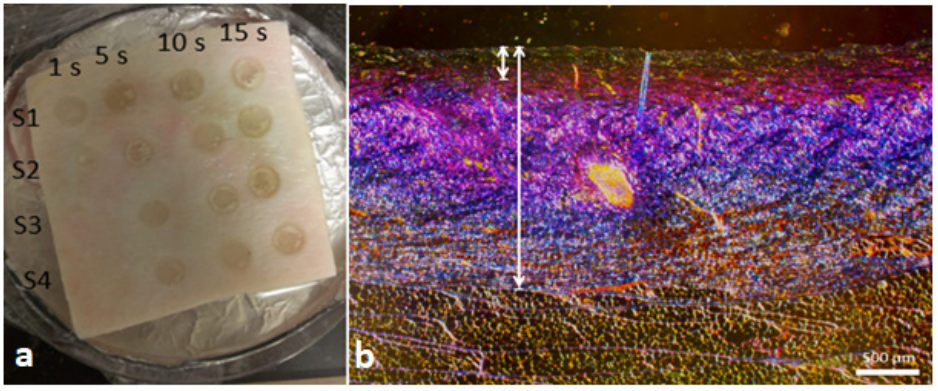
Figure 1. (a) Sample of cadaver porcine skin showing burn wounds created at 1s, 5s, 10s, and 15s durations of time (burns created at 1s were not used in the study). (b) Histological image of 10s burn with coagulated (short line) to total (long line) collagen ratio of less than 0.35—labeled as SPT wound.
Skin’s exposure to heat denatures its collagen structure, resulting in coagulation that corresponds with burn degree [32, 33] and contact time. Consequently, the staining procedure, enhancing collagen in a unique color, helps reveal the amount of coagulation. A ratio of coagulated collagen to total collagen thickness was measured manually from a histological slide using calipers, and a severity level was assigned to each wound according to the ratio value [31]. Burns with values (a) less than 0.35 were labeled as superficial-partial thickness (SPT); (b) between 0.35 and 0.65 as deep-partial thickness (DPT); and (c) above 0.65 as full thickness (FT) wounds (see Figure 1b). Thus, based on the histology results, the final data sample consisted of 28-SPT, 22-DPT, and 26-FT burns.
After the burn wounds were created, each spot was scanned under OCT and RS. Commercial OCT equipment (Thorlabs, Telesto TEL1300V2-BU) with a depth resolution of 5.5 µm (in air) was used to acquire images at 0.201 seconds acquisition time and 76 kHz imaging speed. A single image was formed by averaging 20 horizontal B-scans of 9mm length. The scan region included a small portion of normal skin adjacent to burnt skin, so that the features extracted from the burnt portion could be compared with that of normal skin (see Figure 2). The RS device used in the study was a prototype developed by the VU team [34] that was built using a 785nm laser source at 80mW, a fiber optics probe (EmVision LLC, USA), 10 collection fibers (300µm), and an excitation fiber (200 µm). The device was calibrated for wavelength and intensity before scanning the sample. The effective scanning area was 19mm^2.
![]()
Figure 2. (left) White light image of a SPT burn with red arrow indicating linear scan region from left to right. (right) B-scan acquired from OCT (250 µm) over the region shown in left image. Rectangular red box in both images represents the control (normal) skin region and the region outside it covers burn portion.
Normal spectra (i.e., control, before burn creation) and burn spectra (after burn creation) were obtained four times at each spot with an integration time of three seconds and 20 accumulations. Post-processing steps such as noise reduction techniques and fluorescence background subtraction were applied, which primarily involved binning data to half the spectral resolution and noise filtering with second order Savitzky-Golay filter (window size=2*spectral resolution), and modified polynomial-fitting algorithm for auto-fluorescence subtraction [35, 36]. The final spectra were mean-normalized to account for any variation in intensity.
Data Analysis and Classification
Data analysis included evaluating grayscale images acquired from OCT and spectra from RS. First, OCT images were processed to segment skin region from background, with image processing steps including contrast enhancement, thresholding by Otsu’s method, maximum component determination using flood-fill algorithm, and morphological refinement [37]. Second, depth [16] and statistical textural features (mean, variance, entropy, and smoothness) [38] were computed for non-zero pixels of the segmented images over two 300-column regions corresponding to
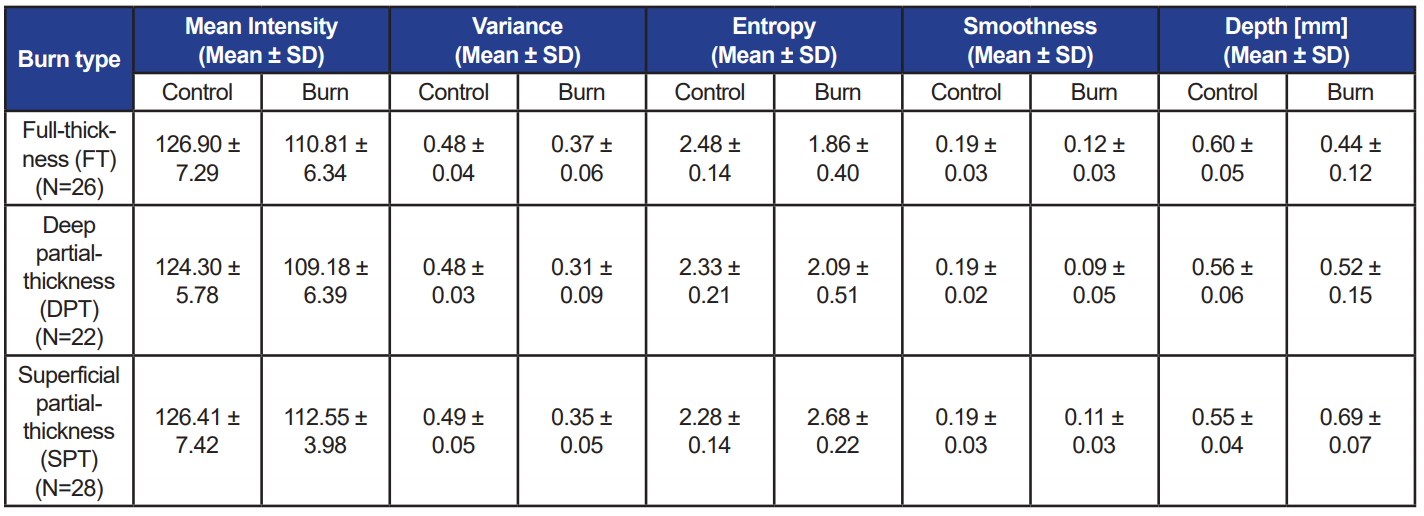
control and burn regions (see Figure 3). Averages of all computed values for different burn types are listed in Table 1. The differences of mean depth between control and burn regions were statistically significant for SPT and FT burns (p<0.01), but insignificant for DPT burns (p=0.23). Considering burn regions, only depth and entropy values significantly decreased from SPT to FT (p<0.01).
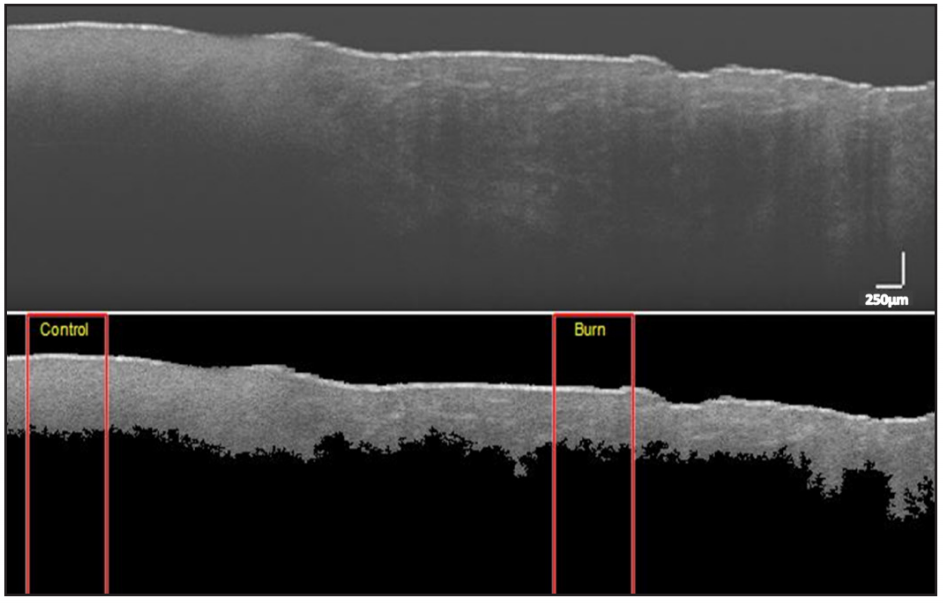
Figure 3. OCT image of superficial-partial thickness burn. (top) Unprocessed image. (bottom) Segmented image. Rectangular red boxes indicate 300-column region used for extracting features (Depth: Control = 0.66mm, Burn = 0.58mm; Entropy: Control = 2.56, Burn = 2.27) (Scale: 250µm).
Table 1. Average values of features computed from OCT scans over control and burn regions for each burn type
The normalized Raman spectra, acquired four times at each burn spot, were reduced to one spectrum per spot via averaging. The spectra, 1D array, consisted of varying intensity values at different wavenumbers; however, we used a range between 800–1,800cm-1 for computing features relevant to skin components. For simplicity in computational flow, the selected range of wavenumbers was divided into bands using a peak-detection algorithm by binning the wavenumbers between two local minima into one band, thus resulting in 18 bands/segments for one spot (see Figure 4).
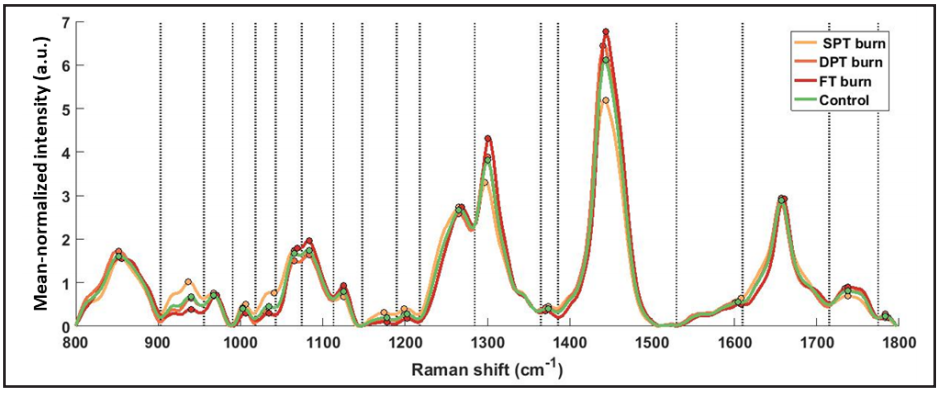
Figure 4. Mean normalized Raman spectra averaged across all spots for each burn type. 18 segments (bands) separated by dotted delimiters, drawn at local minima, were obtained using a peak detection algorithm. All relative features (Method I) (N=54) were computed acrosseach of the 18 segments, and peak intensities in each segment are marked with colored circles.
Accounting for possible spectral artifacts, RS features were computed relative to control spectra (Method I – Relative RS features, N=54/spot). Nevertheless, in real-world situations, acquiring control spectra may not be possible; therefore, another set of features from only burn spectra (Method II – Absolute RS features, N=21/spot) were computed (see Figure 5).
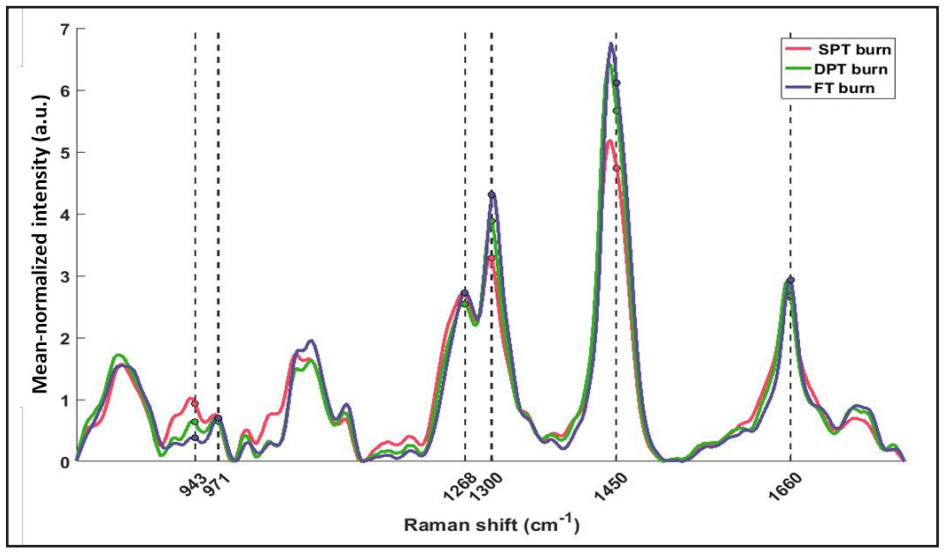
Figure 5. Mean normalized spectra averaged across all spots of different burn severity. Threeof the absolute features (Method II) were computed at wavenumbers clinically relevant to skin tissue (marked with dashed lines). Peak intensity ratios were calculated as: 943/971cm-1 (N-Cα-C/C-C proline ring), 1,300/1,268cm-1 (C-H bending/Amide III), and 1,450/1,660cm-1 (CH2 bending/ Amide I – C=O stretch).
In order to classify burn severity with high reliability, the number of features and training data size were the major factors used to short-list three candidate machine learning (ML) classifiers: logistic regression (LR), linear support vector machines (linear SVM), and random forests (RF). Each classification model was implemented on Waikato Environment for Knowledge Analysis (WEKA) software (University of Waikato, Hamilton, New Zealand), using tenfold cross validation. Accuracy and area under the receiver operator characteristic (AUC-ROC) curve were used to gauge classifiers’ performance [39]. Figure 6 illustrates workflow of the evaluation method that we adapted to identify the robustness of OCT and RS features in distinguishing burns. Each of the three classifiers was tested under two feature sets (Method I and Method II), and the model evaluation metrics were recorded (see Table 2 and Table 3, respectively).
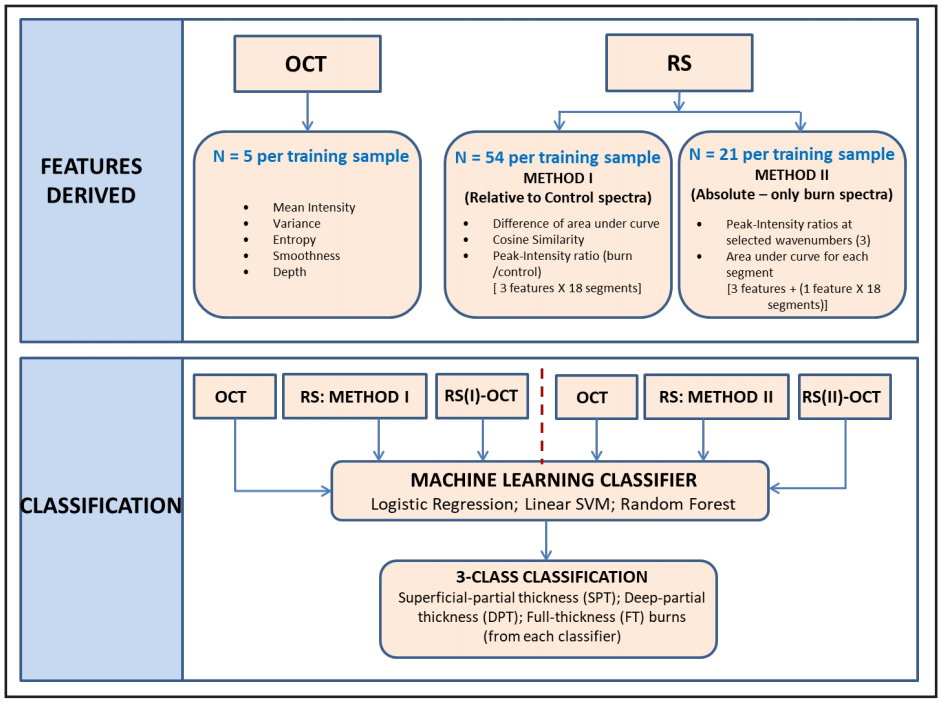 Figure 6. The Features Derived segment denotes all the features derived from OCT images and Raman spectra are listed in the box. The Classification segment denotes the identification of burn degree using three selected classifiers. Each model was trained with five sets of features: OCT, RS (I), RS (II), RS (I)-OCT, and RS (II)-OCT.
Table 2. Performance measures of three selected classifiers each trained with three data sets. RS features used as input are computed relative to control spectra (Method-I). Accuracy and average AUC-ROC values under each case are bolded.
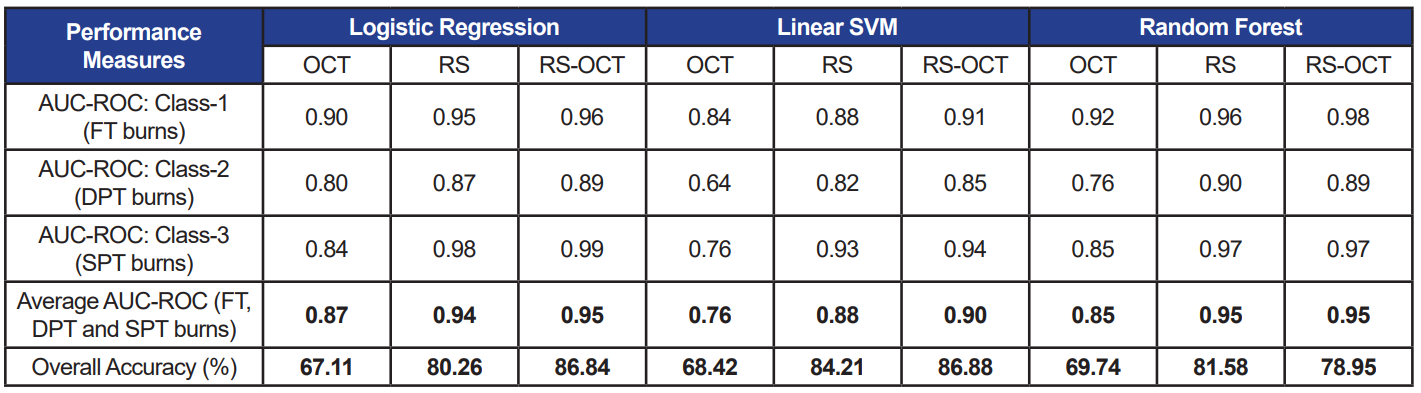
Table 3. Performance measures of three selected classifiers each trained with three data sets. Absolute RS features are used as inputs to the classifiers
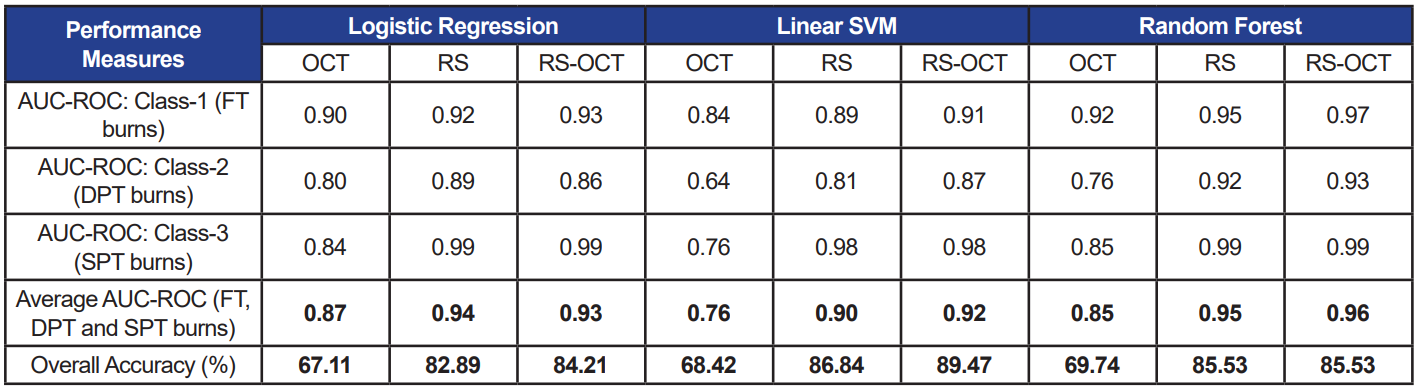
When the three classifiers were trained using only OCT features, accuracy and AUC-ROC ranging from 67–69% and 0.76–0.85 were measured, respectively. The classifier models performed consistently with both, relative (accuracy: 80–84%; AUC-ROC: 0.88–0.95) and absolute (accuracy: 83–87%; AUC-ROC: 0.90–0.95) RS features (p>0.05). Similarly, when combined OCT and RS features were used to train classifiers with the two feature sets (RS-OCT(I): relative; RS-OCT(II): absolute), the classifiers’ performance measures were not statistically different at p=0.05.
Discussion
Our primary aim through the ex vivo study was to demonstrate the ability of an RS-OCT bimodal system to reliably identify the severity of burn wounds. Toward this effort, we achieved a streamlined analytical procedure to process data acquired from the two modalities. We also developed a classification model using ML algorithms to identify burn severity.
The average achieved accuracy of 85% and AUC-ROC=0.94, recorded using a combined pool of RS and OCT features across all classifiers, succinctly indicates the reliability of the bimodal system. Among the three classifiers, LR and RF (both, AUC-ROC=0.92) performed moderately higher than linear SVM (AUCROC=0.86) with all types of input features (RS, OCT, RS-OCT). The separability measure using OCT image features was 0.83, whereas RS features alone provided a higher measure of 0.93—thus demonstrating the significance of the biochemical aspects of skin tissue.
Further, equivalent performance measures observed between relative and absolute RS features (average AUC-ROC across all classifiers: RS (I) = 0.92; RS (II) = 0.93) indicate that the features computed only from burn regions are capable of effectively revealing details pertaining to burn severity. As a result, measures from control regions can be disregarded, thereby reducing computational cost. Although RS alone classifies burn wounds with good accuracy, OCT features cannot be excluded, as it is evident from the repetitive appearance of OCT features (namely, depth and entropy) among the top 10 features picked by various feature selection techniques on WEKA. In addition, the inelastic scattering of RS has weak characteristic rendering it as a point-and-shoot method, which is compensated by the ability of OCT scans to cover a wider region. This underscores the value of combining the two optical techniques.
Outlook
In future work, we aim to perform in vivo studies to account for potential influencing factors, such as presence of blood flow, hair, occurrence of edema, and respiration. Additionally, to enhance the bimodal system’s capability, we plan to develop a unified RS-OCT probe, where the Raman spectra will be acquired based on the guidance provided by OCT. A compact system will also be easy to use without needing specific training or skill.
Toward this effort, effective registration and data fusion algorithms will be developed and current processing methods will be modified accordingly. Furthermore, decision-level ML algorithms, where results from individual modalities are fused to classify burns, will be explored and optimized to improve the accuracy of the system [40]. As part of an advanced diagnostic system, UC also plans to include decision-based intervention support sub-systems that can provide information on the type of treatment to be given based on burn severity.
In conclusion, satisfactory discernibility established by the ex vivo study signifies the effectiveness of the bimodal diagnostic system in objectively identifying severity of burns and fosters future in vivo studies. Such a system which can efficiently discern burns, especially superficial-partial and deep-partial burns, will be a promising diagnostic tool for medics on the battlefield that will aid in prompt decision-making on treatment steps, thereby reducing mortality rates and improving warfighter burn injury treatment.
References
1. Centers for Disease Control and Prevention. (2019, January 18). Leading causes of nonfatal injury records, 2000–2017. U.S. Department of Health and Human Services. Retrieved from https://webap-pa.cdc.gov/sasweb/ncipc/nfilead.html
2. Chung, K. K., Blackbourne, L. H., Wolf, S. E., White, C. E., Renz, E. M., Cancio, L. C., … & Barillo, D. J. (2006). Evolution of burn resuscitation in operation Iraqi freedom. Journal of Burn Care & Research, 27(5), 606–611. doi:10.1097/01.BCR.0000235466.57137.f2
3. Kauvar, D. S., Wolf, S. E., Wade, C. E., Cancio, L. C., Renz, E. M., & Holcomb, J. B. (2006). Burns sustained in combat explosions in Operations Iraqi and Enduring Freedom (OIF/OEF explosion burns). Burns, 32(7), 853–857. doi:10.1016/j.burns.2006.03.008
4. Gray, D. T., Pine, R. W., Harnar, T. J., Marvin, J. A., Engrav, L. H., & Heimbach, D. M. (1982). Early surgical excision versus conventional therapy in patients with 20 to 40 percent burns: a comparative study. The American Journal of Surgery, 144(1), 76–80. doi:10.1016/0002-9610(82)90605-5
5. Sjöberg, F., Danielsson, P., Andersson, L., Steinwall, I., Zdolsek, J., Östrup, L., & Monafo, W. (2000). Utility of an intervention scoring system in documenting effects of changes in burn treatment. Burns, 26(6), 553-559. doi:10.1016/S0305-4179(00)00004-8
6. Burmeister, D. M., Ponticorvo, A., Yang, B., Becerra, S. C., Choi, B., Durkin, A. J., & Christy, R. J. (2015, September). Utility of spatial frequency domain imaging (SFDI) and laser speckle imaging (LSI) to non-invasively diagnose burn depth in a porcine model. Burns, 41(6), 1242–1252. doi:10.1016/j.burns.2015.03.001
7. Rylander, M. N. (personal communication with HDIAC, May 7, 2019). Used with permission.
8. Atiyeh, B. S., Gunn, S. W. A., & Hayek, S. N. (2007). Military and civilian burn injuries during armed conflicts. Annals of Burns and Fire Disasters, 20(4), 203. Retrieved from https://www.ncbi.nlm.nih.gov/pmc/articles/PMC3188083/
9. Heimbach, D. M., Afromowitz, M. A., Engrav, L. H., Marvin, J. A., & Perry, B. (1984). Burn depth estimation—man or machine. The Journal of Trauma, 24(5), 373–378.
10. Riordan, C. L., McDonough, M., Davidson, J. M., Corley, R., Perlov, C., Barton, R., … & Nanney, L. B. (2003). Noncontact laser Doppler imaging in burn depth analysis of the extremities. The Journal of Burn Care & Rehabilitation, 24(4), 177–186. doi:10.1097/01.BCR.0000075966.50533.B0
11. Monstrey, S., Hoeksema, H., Verbelen, J., Pirayesh, A., & Blondeel, P. (2008). Assessment of burn depth and burn wound healing potential. Burns, 34(6), 761–769. doi:10.1016/j.burns.2008.01.009
12. Hoeksema, H., Van de Sijpe, K., Tondu, T., Hamdi, M., Van Landuyt, K., Blond- eel, P., & Monstrey, S. (2009). Accuracy of early burn depth assessment by laser Doppler imaging on different days post burn. Burns, 35(1), 36–45. doi:10.1016/j.burns.2008.08.011
13. Kaiser, M., Yafi, A., Cinat, M., Choi, B., & Durkin, A. J. (2011). Noninvasive assess- ment of burn wound severity using optical technology: A review of current and future modalities. Burns, 37(3), 377-386. doi:10.1016/j.burns.2010.11.012
14. Droog, E. J., Steenbergen, W., & Sjöberg, F. (2001). Measurement of depth of burns by laser Doppler perfusion imaging. Burns, 27(6), 561–568. doi:10.1016/S0305-4179(01)00021-3
15. Resch, T. R., Drake, R. M., Helmer, S. D., Jost, G. D., & Osland, J. S. (2014). Estimation of burn depth at burn centers in the United States: a survey. Journal of Burn Care & Research, 35(6), 491–497. doi:10.1097/BCR.0000000000000031
16. Ganapathy, P., Tamminedi, T., Qin, Y., Nanney, L., Cardwell, N., Pollins, A., … & Yadegar, J. (2014). Dual-imaging system for burn depth diagnosis. Burns, 40(1), 67–81. doi:10.1016/j.burns.2013.05.004
17. Olsen, J., Themstrup, L., & Jemec, G. B. (2015). Optical coherence tomography in dermatology. Giornale Italiano di Dermatologia e Venereologia, 150(5), 603–615.
18. Silver, R., Helms, A., Fu, W., Wang, H., Diaconu, D., Loyd, C. M., … & Ward, N. L. (2012). Using optical coherence tomography for the longitudinal non-invasive evaluation of epidermal thickness in a murine model of chronic skin inflammation. Skin Research and Technology, 18(2), 225–231. doi:10.1111/j.1600-0846.2011.00558.x
19. Welzel, J. (2001). Optical coherence tomography in dermatology: A review. Skin Research & Technology, 7(1), 1–9. doi:10.1034/j.1600-0846.2001.007001001.x
20. Pierce, M. C., Sheridan, R. L., Park, B. H., Cense, B., & de Boer, J. F. (2004). Collagen denaturation can be quantified in burned human skin using polarization-sensitive optical coherence tomography. Burns, 30(6), 511–517. doi:10.1016/j.burns.2004.02.004
21. Themstrup, L., De Carvalho, N., Nielsen, S. M., Olsen, J., Ciardo, S., Schuh, S., … & Jemec, G. B. (2018). In vivo differentiation of common basal cell carcinoma subtypes by microvascular and structural imaging using dynamic optical coherence tomography. Experimental Dermatology,
27(2), 156–165. doi:10.1111/exd.13479
22. Gong, P., Es’haghian, S., Wood, F. M., Sampson, D. D., & McLaughlin, R. A. (2016). Optical coherence tomography angiography for longitudinal monitoring of vascular changes in human cutaneous burns. Experimental Dermatology, 25(9), 722–724. doi:10.1111/exd.13053
23. Hettiaratchy, S., & Dziewulski, P. (2004). Pathophysiology and types of burns. The BMJ, 328(7453), 1427–1429. doi:10.1136/bmj.328.7453.1427
24. Caspers, P. J., Lucassen, G. W., Wol- thuis, R., Bruining, H. A., & Puppels, G. J. (1999). In vitro and in vivo Raman spectroscopy of human skin. Biospectroscopy, 4(S5), S31–S39. doi:10.1002/(SICI)1520-6343(1998)4:5+<S31::AIDBSPY4>3.0.CO;2-M
25. Lui, H., Zhao, J., McLean, D., & Zeng, H. (2012). Real-time Raman spectroscopy for in vivo skin cancer diagnosis. Cancer Research, 72(10), 2491–2500. doi:10.1158/0008-5472.CAN-11-4061
26. Caspers, P. J., Bruining, H. A., Puppels, G. J., Lucassen, G. W., & Carter, E. A. (2001). In vivo confocal Raman microspectroscopy of the skin: noninvasive determination of molecular concentration profiles. Journal of Investigative Dermatology, 116(3), 434–442. doi:10.1046/j.1523-1747.2001.01258.x
27. Lieber, C. A., Majumder, S. K., Ellis, D. L., Billheimer, D. D., & Mahadevan-Jan- sen, A. (2008, September). In vivo non-melanoma skin cancer diagnosis using Raman microspectroscopy. Lasers in Surgery and Medicine, 40(7): 461–467. doi:10.1002/lsm.20653
28. Peterson, J. R., Okagbare, P. I., De La Rosa, S., Cilwa, K. E., Perosky, J. E., Eb- oda, O. N., … & Wang, S. C. (2013). Early detection of burn induced heterotopic ossification using transcutaneous Raman spectroscopy. Bone, 54(1), 28–34. doi:10.1016/j.bone.2013.01.00
29. Patil, C. A., Kirshnamoorthi, H., Ellis, D. L., van Leeuwen, T. G., & Mahadevan-Jansen, A. (2011). A clinical instrument for combined raman spectroscopy-optical coherence tomography of skin cancers. Lasers in Surgery and Medicine, 43(2), 143–151. doi:10.1002/lsm.21041
30. Liu, C. H., Qi, J., Lu, J., Wang, S., Wu, C., Shih, W. C., & Larin, K. V. (2015). Improvement of tissue analysis and classification using optical coherence tomography combined with Raman spectroscopy. Journal of Innovative Optical Health Sciences, 8(4), 1550006. doi:10.1142/S1793545815500066
31. Ponticorvo, A., Burmeister, D. M., Yang, B., Choi, B., Christy, R. J., & Durkin, A. J. (2014). Quantitative assessment of graded burn wounds in a porcine model using spatial frequency domain imaging (SFDI) and laser speckle imaging (LSI). Biomedical Optics Express, 5(10), 3467–3481. doi:10.1364/BOE.5.003467
32. Thomsen, S. (1991). Pathologic analysis of photothermal and photomechanical effects of laser–tissue interactions. Photochemistry and Photobiology, 53(6), 825–835. doi:10.1111/j.1751-1097.1991.tb09897.x
33. Chvapil, M., Speer, D. P., Owen, J. A., & Chvapil, T. A. (1984). Identification of the depth of burn injury by collagen stainability.